West Calder weather
Latitude N 55° 50' 09" Longitude E 03° 34' 07" Elevation 600 ft
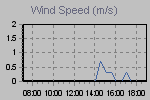
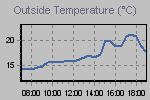
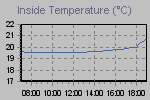
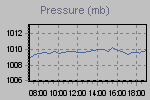
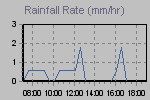
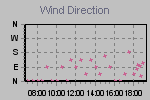
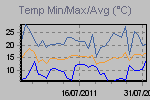
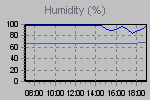
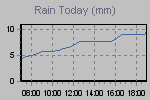
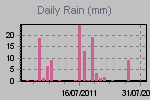
These graphs present the temperature, pressure, rainfall, and wind speed trends for the last 12 hours.
The thumbnail graphs are sampled every ten minutes. Click on a thumbnail to display the corresponding larger graph in the panel above it. The large graphs are sampled every minute.

| Click on a thumbnail to show a large graph in the panel above. | ||||
 |
 |
 |
 |
 |
 |
 |
 |
 |
 |
| :now::gauges::today::yesterday::records::trends::forum: | ||||
Page updated 02/08/2011 19:03:45
powered by
Cumulus v1.9.1 (974)